Economy
EU tax and social contribution revenue up in 2022

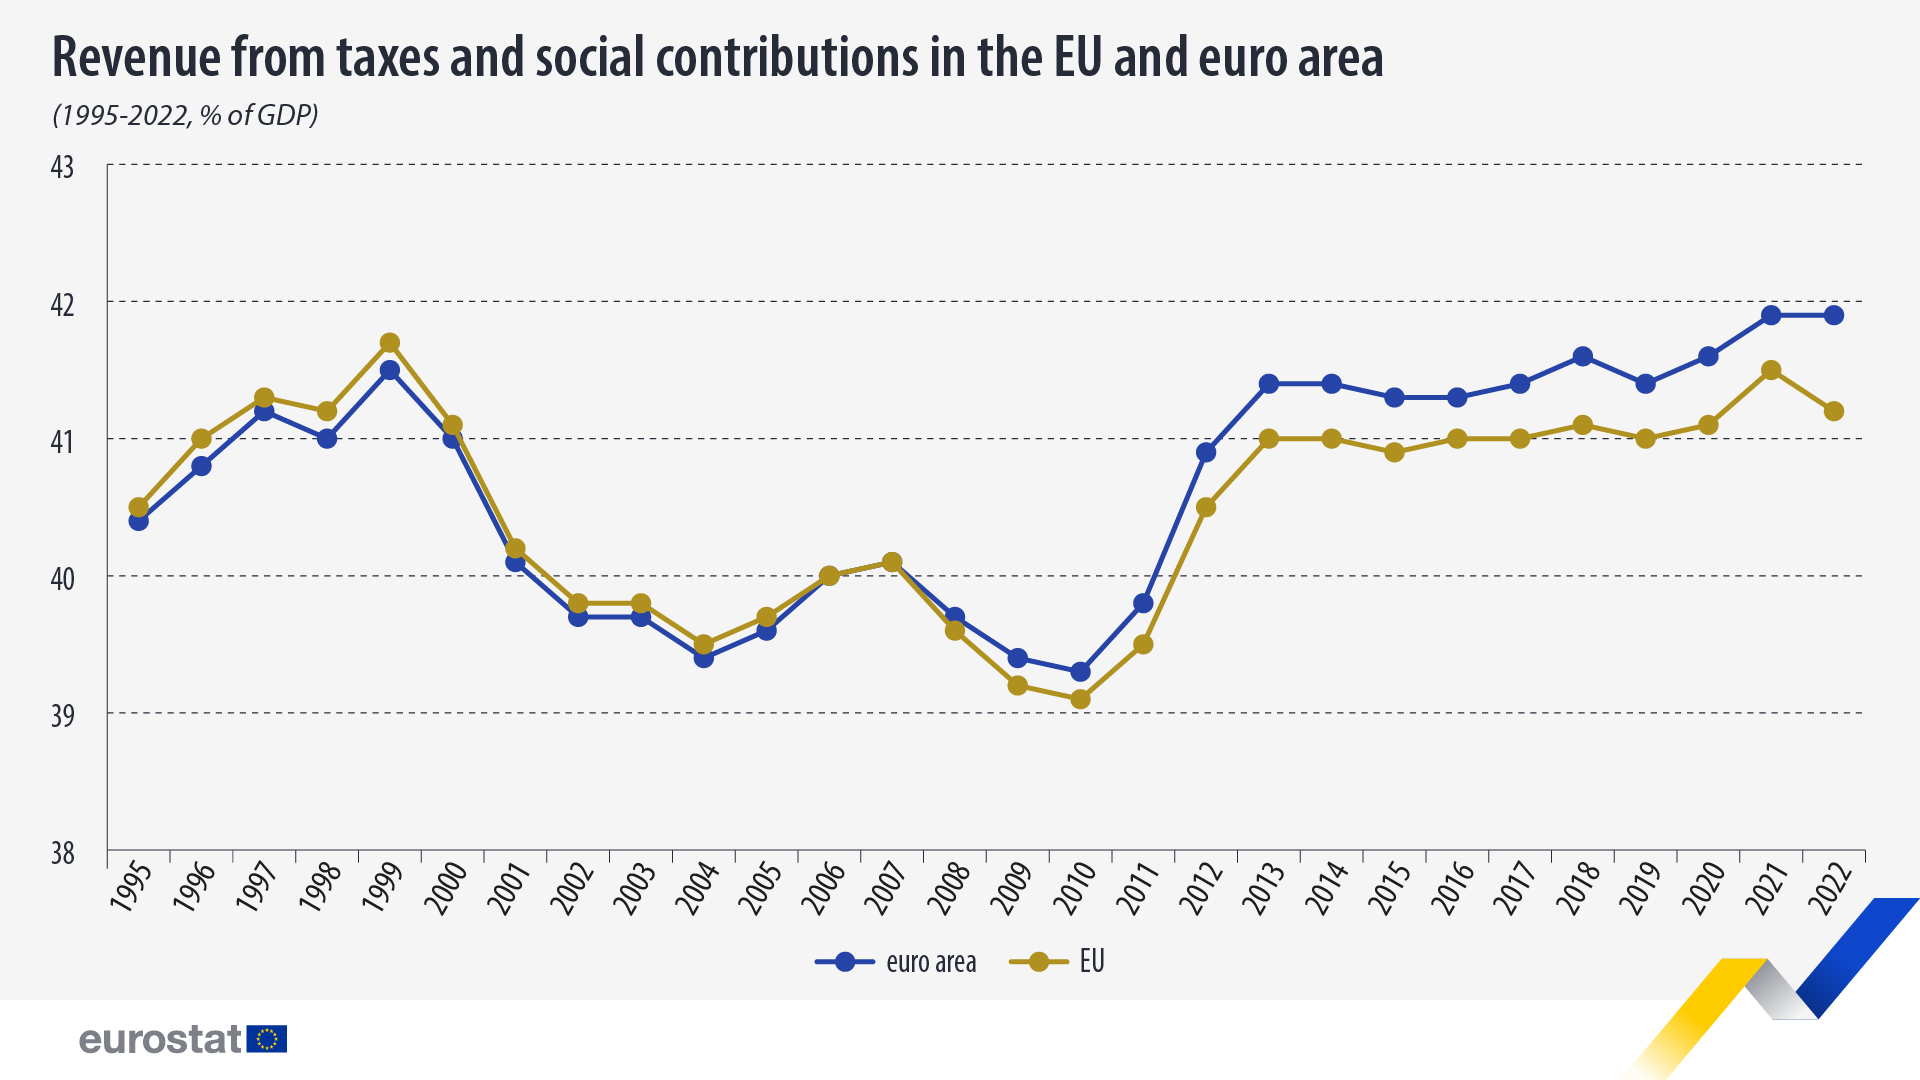
The overall tax-to-GDP ratio, meaning the sum of taxes and net social contributions as a percentage of gross domestic product (GDP), stood at 41.2% in the EU in 2022, a decrease compared with 2021 (41.5%). In the euro area, tax revenue increased in line with nominal GDP, meaning that the tax-to-GDP ratio in 2022 remained stable at 41.9%.
This information comes from data on taxation published by Eurostat. This article presents some findings from the more detailed Statistics Explained article.

Source dataset: gov_10a_taxag
In absolute terms, in 2022, revenue from taxes and social contributions increased by €480 billion in the EU compared with 2021, to stand at €6,549 billion.
Highest tax-to-GDP ratio in France, Belgium and Austria
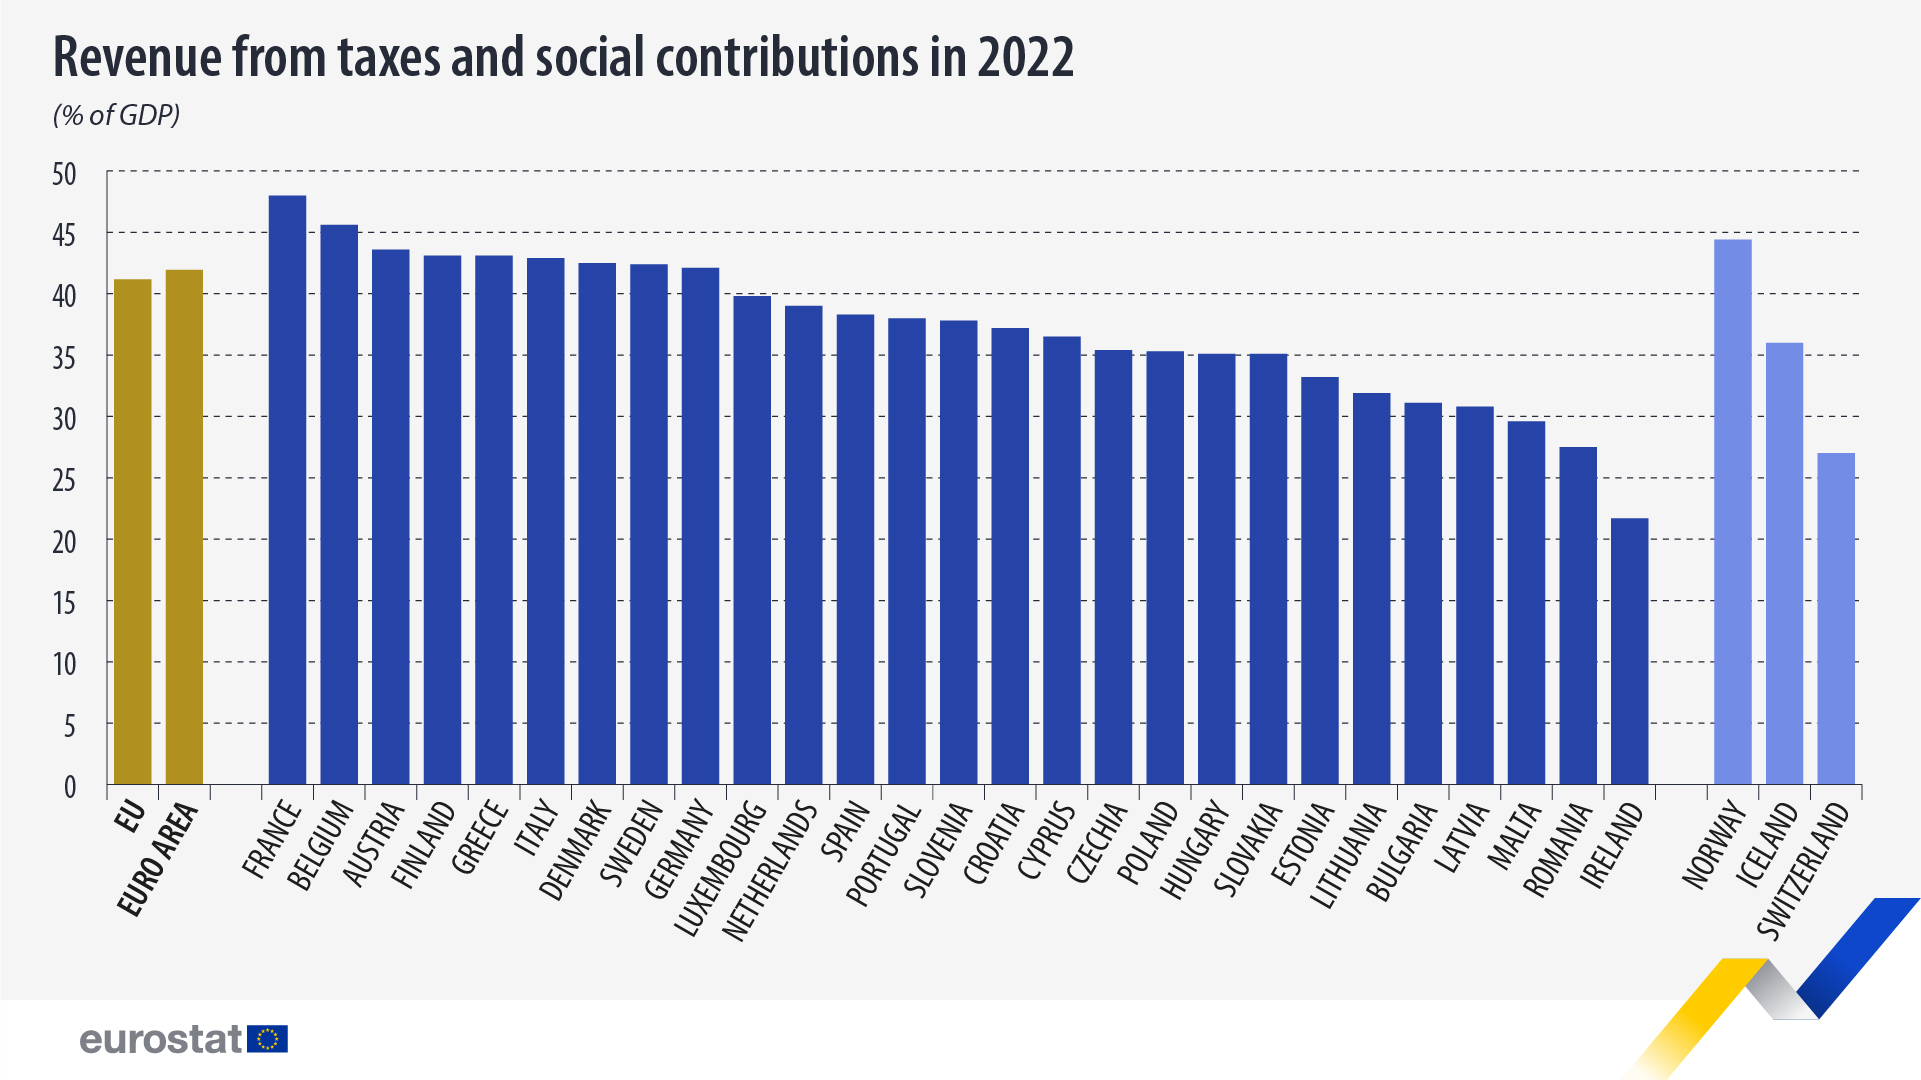
The tax-to-GDP ratio varied significantly between EU countries in 2022, with the highest shares of taxes and social contributions as a percentage of GDP being recorded in France (48.0%), Belgium (45.6%) and Austria (43.6%).

Source dataset: gov_10a_taxag
At the opposite end of the scale, Ireland (21.7%), Romania (27.5%) and Malta (29.6%) registered the lowest ratios.
Largest increase of tax-to-GDP ratio in Cyprus, largest decrease in Denmark
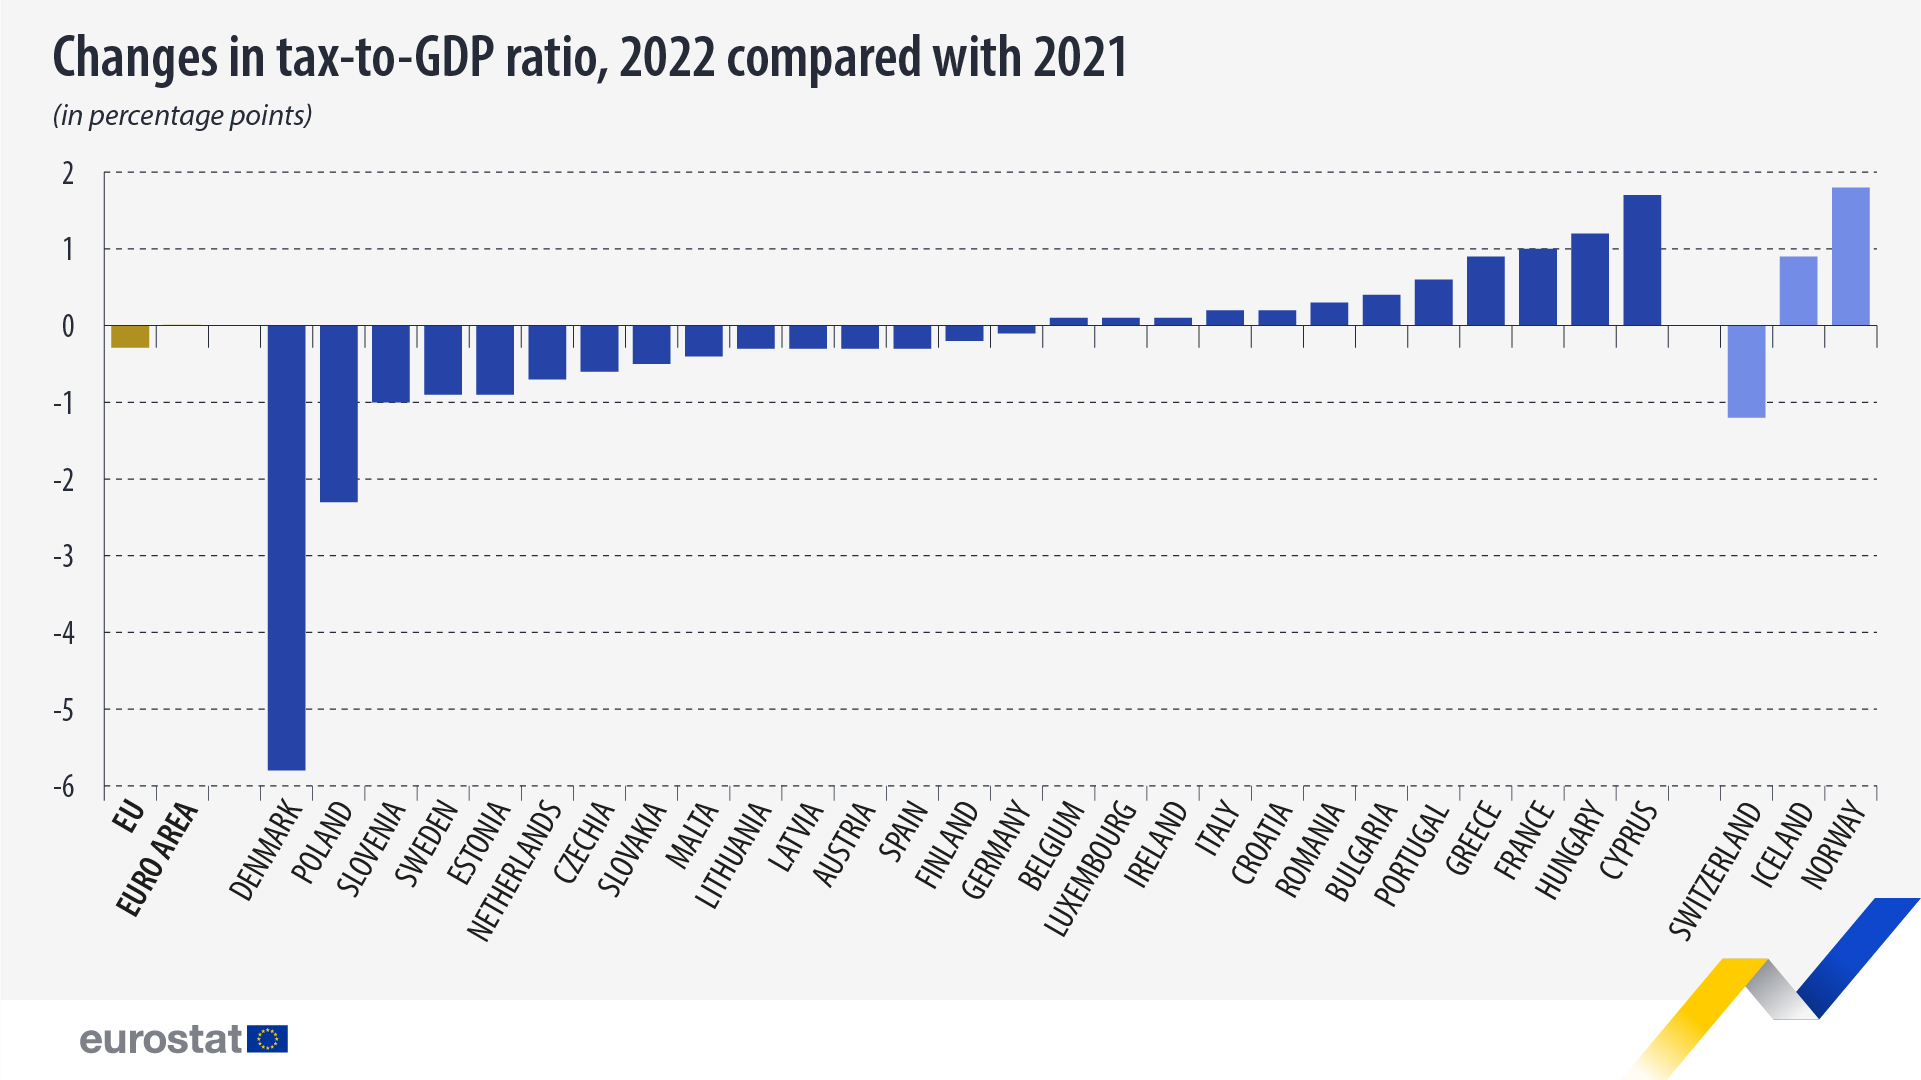
In 2022, compared with 2021, the tax-to-GDP ratio increased in twelve EU countries, with the largest increases being observed in Cyprus (from 34.8% in 2021 to 36.5% in 2022) and Hungary (33.9% in 2021 and 35.1% in 2022).

Source dataset: gov_10a_taxag
In contrast, decreases were recorded in fifteen EU countries, notably in Denmark (from 48.3% in 2021 to 42.5% in 2022) and Poland (from 37.6% to 35.3%).
More information
- Statistics Explained article on tax revenue statistics
- Thematic section on government finance statistics
- Database on government finance statistics
- Metadata file on taxes and social contributions
Methodological notes
- Up to 31 December 2022, the euro area (EA19) included Belgium, Germany, Estonia, Ireland, Greece, Spain, France, Italy, Cyprus, Latvia, Lithuania, Luxembourg, Malta, the Netherlands, Austria, Portugal, Slovenia, Slovakia and Finland. From 1 January 2023 the euro area (EA20) also includes Croatia. The aggregate data series commented on in this article refers to the official composition of the euro area in the most recent period for which data is available. Thus, EA19 is used throughout.
If you have any queries, please visit the contact page.
Share this article:
-

 World5 days ago
Dénonciation de l’ex-emir du mouvement des moujahidines du Maroc des allégations formulées par Luk Vervae
-

 Moldova5 days ago
Former US Department of Justice and FBI Officials cast shade on the case against Ilan Shor
-

 China-EU4 days ago
CMG hosts 4th International Chinese Language Video Festival to mark 2024 UN Chinese Language Day
-

 European Parliament4 days ago
A solution or a straitjacket? New EU fiscal rules


