EU
Team Europe increased Official Development Assistance to €66.8 billion as the world's leading donor in 2020

The EU and its 27 member states have significantly increased their Official Development Assistance (ODA) for partner countries to €66.8 billion in 2020. This is a 15% increase in nominal terms and equivalent to 0.50% of collective Gross National Income (GNI), up from 0.41% in 2019, according to preliminary figures published today by the Organization for Economic Co-operation and Development's Development Assistance Committee (OECD-DAC). The EU and its member states thereby confirm their position as the world's leading donor, providing 46% of global assistance from the EU and other DAC donors, and have taken a major leap forward towards meeting the commitment to provide at least 0.7% of collective GNI as ODA by 2030.
International Partnerships Commissioner Jutta Urpilainen said: “Team Europe has significantly increased its contribution of Official Development Assistance compared to last year. This is crucial at a time when so many people in our partner countries face significant health, economic and social challenges linked to the COVID-19 crisis. The latest figures show that 10 years ahead of the due date to deliver on our commitment to provide 0.7% of our collective GNI as ODA, we are more determined than ever to achieve this target.”
Overall, 17 Member States increased their ODA in nominal terms in 2020 compared to 2019, with the strongest nominal increases coming from Germany (+€3.310bn), France (+€1.499bn) and Sweden (+€921 million), and further increases coming from Austria, Belgium, Bulgaria, Croatia, Cyprus, Denmark, Finland, Hungary, Latvia, Malta, Poland, Romania, Slovakia and Slovenia. The EU institutions' ODA (meaning the European Commission and the EIB) increased by €3.7bn (27%) overall in 2020 in nominal terms. 15 member states improved their ODA relative to their GNI by at least 0.01 percentage points: Austria, Belgium, Bulgaria, Croatia, Denmark, Finland, France, Germany, Hungary, Latvia, Malta, Romania, Slovakia, Spain and Sweden. In Cyprus and Greece, ODA as a share of GNI decreased by at least 0.01 percentage points.
In response to the coronavirus pandemic, the EU, its member states, and the European financial institutions, together with the European Investment Bank and the European Bank for Reconstruction and Development, have combined their financial resources as Team Europe, mobilising over €40bn in support to partner countries in 2020. 65% of this amount was already disbursed in 2020 in support of the immediate humanitarian needs; health, water, sanitation and nutrition systems, as well as tackling the social and economic consequences of the pandemic. The unprecedented nature of the COVID-19 crisis has put a huge stress on public finances and debt sustainability of many developing countries, affecting their ability to achieve the Sustainable Development Goals. This is why, in May 2020, President von der Leyen called for a Global Recovery Initiative, linking debt relief and investment to the SDGs to promote a green, digital, just and resilient recovery. The Global Recovery Initiative is about shifting to policy choices supporting green and digital transitions, social inclusiveness and human development while enhancing debt sustainability in partner countries.
ODA is one of the sources of financing to deliver on the SDGs, although more transparency is needed on all sources of finance for sustainable development. As an important step in that direction, data on Total Official Support for Sustainable Development (TOSSD) has been collected and published for the first time, increasing transparency on all officially-supported resources for the SDGs, including South-South co-operation, support to global public goods such as vaccine research and climate mitigation as well as private finance mobilized by official interventions.
Background
The data published today is based on preliminary information reported by the EU Member States to the OECD pending detailed final data to be published by OECD by early 2022. EU collective ODA consists of the total ODA spending of EU member states and the ODA of the EU institutions not attributed to individual member states or the UK (notably own resources of the European Investment Bank and, for the first time in 2020, special macro-financial assistance loans on a grant equivalent basis).
Despite its withdrawal from the European Union taking effect on 1 February 2020, the United Kingdom still contributed funding in the form of ODA to the EU budget and the European Development Fund in 2020. This is included in the EU institutions' ODA. However, in order to avoid double-counting between the ODA reported as EU collective ODA and the ODA reported by the United Kingdom itself, the United Kingdom's contribution to EU institutions is not included in what is reported as EU collective ODA.
Four EU member states already exceeded the 0.7% target of ODA as a share of GNI in 2020: Sweden (1.14%), Luxembourg (1.02%), Denmark (0.73%) and Germany (0.73%).
When highlighting the member states which increased or decreased their ODA as a share of GNI, only cases where the change amounts to at least 0.01 percentage points (based on exact rather than rounded values) are taken into account, while member states for which the change is smaller than 0.01 percentage points in either direction are considered to have kept their ODA as a share of GNI stable.
The EU and its member states thereby perform significantly above the average of non-EU DAC donors in terms of their ODA as a share of GNI, standing at 0.50% compared to 0.26% by the aggregate of all non-EU DAC donors.
In May 2015, the European Council reaffirmed its commitment to increase collective ODA to 0.7% of EU collective GNI by 2030. Since 2015, on a flow basis, ODA by the EU and its current 27 member states has grown by 37% (€18.7bn) in nominal terms while the ODA/GNI ratio has increased by 0.1 percentage points. The year 2020 marks a turn in the previous trend of declining ODA since the 2016 climax when the EU and its then 28 member states' ODA reached 0.52% of GNI. This turn is due partly to an absolute increase in collective ODA in nominal terms, and partly to an absolute decrease in collective GNI in nominal terms. The EU is also committed to give collectively between 0.15% and 0.20% of the EU GNI in the short term to Least Developed Countries (LDCs) and 0.20% by 2030. Since 2015, on a flow basis, ODA by the EU and its current 27 member states to LDCs has grown by 34% (€3.5bn) in nominal terms to reach €13.8bn (0.10% of GNI) in 2019, and the ODA to LDCs/GNI ratio has increased by 0.01 percentage points. Moreover, compared to 2018, the EU and its then 28 member states increased their aggregate ODA to Africa by 3.6% in nominal terms to €25.9bn in 2019. Data on ODA to LDCs, Africa and other specific recipients for 2020 are expected by early 2022.
Scaling up sustainable finance and private sector engagement in partner countries is essential, coupled with reforms to enhance business climates, as meeting the challenges of the Global Recovery Initiative cannot be achieved by ODA alone. The EU has been instrumental in bringing together aid, investment, trade, domestic resource mobilisation and policies designed to unlock the full potential of all financial flows. The European Fund for Sustainable Development guarantee in particular has played a key role in unlocking additional finance for partner countries. Over the last year alone, the EU signed €1.55bn worth of financial guarantees with our partner financial institutions, leveraging over €17bn of investments – also helping to ensure that recovery from the pandemic is green, digital, just and resilient.
More information
Q&A on preliminary figures on 2020 Official Development Assistance for the EU and its member states
Commission's publication of figures on the global COVID-19 response
Share this article:
EU Reporter publishes articles from a variety of outside sources which express a wide range of viewpoints. The positions taken in these articles are not necessarily those of EU Reporter. Please see EU Reporter’s full Terms and Conditions of publication for more information EU Reporter embraces artificial intelligence as a tool to enhance journalistic quality, efficiency, and accessibility, while maintaining strict human editorial oversight, ethical standards, and transparency in all AI-assisted content. Please see EU Reporter’s full A.I. Policy for more information.


The South Caucasus at a historic turning point: Between lasting peace and renewed confrontation
The security environment of the South Caucasus amid changing geopolitical realities

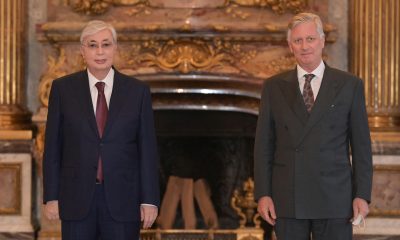
Kazakhstan and Belgium: Building a Partnership for the Future

Commission registers two European Citizens' Initiatives on education and housing

Why the US is losing its legitimacy as a global superpower and the trust of the comity of nations

Commission sends Statements of Objections to several companies and trade associations in suspected construction chemicals cartel

Commission endorses Latvia’s €617 million Social Climate Plan to support vulnerable households and transport users in the clean transition

Rome–Washington Axis: Italian Diplomat Zanardi Landi to Help Save Bosnia

JoinCare explores scientific exchange during visit to Japan’s National Institute of Infectious Diseases

New episode – DGT podcast: Languages and Technology

Become a European Commission trainee – applications are now open

Commission outlines measures to strengthen Europe's banking sector and support growth

British political shifts and the future of UK-China ties
The South Caucasus at a historic turning point: Between lasting peace and renewed confrontation

As Ireland chairs the EU Presidency, what impact has over fifty years of EU membership had on Ireland

The Digital Markets Act Is Hurting Europeans. It’s Time to Put Progress, Free Markets, and Competition First

Kazakhstan reforms under scrutiny at Brussels Press Club round table

Japan should face up to history and contribute more to regional peace

Ambassador calls for 'speeding up' of co-operation between EU and Kazakhstan

Timur Turlov at Smart Moves Summit 2025: How chess can transform global education

Shevtsova’s case: Out-of-court sanctions dismantling trust in Ukrainian cause
The future of European transport

Trump Vs Trueman

US 'no longer' an 'unconditional ally' for Europe - MEP
-
 South Caucasus1 day ago
The South Caucasus at a historic turning point: Between lasting peace and renewed confrontation
-
South Caucasus2 days ago
The security environment of the South Caucasus amid changing geopolitical realities
-
 Belgium5 days ago
Kazakhstan and Belgium: Building a Partnership for the Future
-
 European Citizens' Initiative4 days ago
Commission registers two European Citizens' Initiatives on education and housing