European Commission
Create your maps with IMAGE, our map generator tool

Have you ever wondered how statistical maps are prepared? Would you like to prepare your own?
The Interactive Map Generator (IMAGE) is a web-based tool that allows users to quickly make professional statistical maps in several predefined map layouts. You can add your data, or load data directly from the Eurostat database.
What’s special about our map generator is that it offers a wide variety of options. For example, you can create maps of the EU at the national and regional level, including all the overseas regions, but also a map of your own country or a world map.
Another interesting feature is the map type, where you can choose the map format according to the characteristics of the data and what you want to show. For example, we have choropleth maps for densities, proportions and rates of change, but if you want to show volumes and total amounts, we recommend the use of proportional symbols.
To make sure all the requirements to have the perfect map are met and the best practices are followed, we have also included a final checklist.
Click here and visit the interactive map generator tool.
Share this article:
EU Reporter publishes articles from a variety of outside sources which express a wide range of viewpoints. The positions taken in these articles are not necessarily those of EU Reporter. Please see EU Reporter’s full Terms and Conditions of publication for more information EU Reporter embraces artificial intelligence as a tool to enhance journalistic quality, efficiency, and accessibility, while maintaining strict human editorial oversight, ethical standards, and transparency in all AI-assisted content. Please see EU Reporter’s full A.I. Policy for more information.


European operation dismantles €10 million illicit cigarette network in Spain

EU foreign ministers to discuss options for restricting trade with Israeli communities in Judea and Samaria

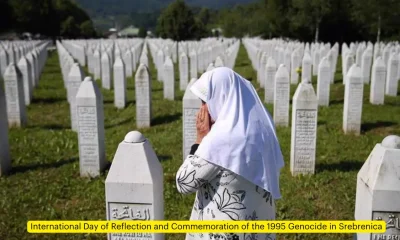
Srebrenica's lesson is prevention. Why isn't the world applying It to Kashmir?

Energy Union Task Force takes stock of oil and gas security of supply in the EU

AIFC to host Astana Finance Days 2026 in September

ALROSA Re-elects Supervisory Board with Minimal Changes

EU launches a Team Gaza Initiative to support early recovery in Gaza with an initial amount of nearly €900 million

Joint statement by High Representative/Vice-President Kallas and Commissioner Kos on the 31st anniversary of the Srebrenica genocide

Commission approves French state aid to support offshore wind energy

Natura 2000 Network offers opportunities for sustainable tourism across Europe

Commission adds exemptions to rules on removability of portable batteries

EU steps up international support for Palestinians with major initiative for Gaza's early recovery and stronger international coordination

Kurmuk gold project highlights Africa’s changing investment landscape

Falling in love with the Maldives

Britain’s leadership crisis is a symptom, not the disease

Chinese “leadership and coordination”

Kazakhstan reforms under scrutiny at Brussels Press Club round table

Japan should face up to history and contribute more to regional peace

Ambassador calls for 'speeding up' of co-operation between EU and Kazakhstan

Timur Turlov at Smart Moves Summit 2025: How chess can transform global education

Shevtsova’s case: Out-of-court sanctions dismantling trust in Ukrainian cause
The future of European transport

Trump Vs Trueman

US 'no longer' an 'unconditional ally' for Europe - MEP
-
 Cigarettes3 days ago
European operation dismantles €10 million illicit cigarette network in Spain
-
 Israel4 days ago
EU foreign ministers to discuss options for restricting trade with Israeli communities in Judea and Samaria
-
 Kashmir3 days ago
Srebrenica's lesson is prevention. Why isn't the world applying It to Kashmir?
-
 Energy market2 days ago
Energy Union Task Force takes stock of oil and gas security of supply in the EU