Consumers
Consumption per capita among member states: Highest rate nearly triple lowest
Actual Individual Consumption (AIC)1 is a measure of material welfare of households. Based on first preliminary estimates for 20132, AIC per capita expressed in Purchasing Power Standards3 (PPS) varied from 49% to 138% of the EU-28 average across the member states.
Actual individual consumption per capita in PPS in 2013, EU28 = 100

The highest level of Actual Individual Consumption per capita in the EU28 was recorded in Luxembourg with a level of almost 40% above the EU28 average. Germany was 25% above the average and Austria, Sweden, Denmark, Belgium, Finland, France and the United Kingdom recorded levels between 10% and 20% above the average, while the Netherlands was just below 10% above.
In Ireland, Italy, Cyprus and Spain,the levels were up to 10% below the EU28 average, while Malta and Greece were between 10% and 20% below. Lithuania, Slovenia, Portugal, Poland, Slovakia and the Czech Republic werebetween 20% and 30% below the average, while Latvia, Estonia, Hungary and Croatia were between 30% and 40% below. Romania and Bulgaria were around 50% below the average.
These figures for actual individual consumption per capita, expressed in PPS, are published by Eurostat, the statistical office of the European Union.
GDP per capita varied by one to six across the member states
Gross Domestic Product (GDP) per capita, a measure of economic activity, shows substantial differences between the member states. In 2013, GDP per capita expressed in PPS ranged between 47% of the EU average in Bulgaria to 264% in Luxembourg4.
Actual Individual Consumption (AIC) and GDP per capita in PPS in 2013, EU28 = 100
| AIC per capita | GDP per capita | |
| EU28 | 100 | 100 |
| Eurozone5 | 106 | 108 |
| Luxembourg | 138 | 264 |
| Germany | 125 | 124 |
| Austria | 119 | 129 |
| Sweden | 118 | 127 |
| Denmark | 115 | 125 |
| Belgium | 114 | 119 |
| Finland | 114 | 112 |
| France | 113 | 108 |
| United Kingdom | 113 | 106 |
| Netherlands | 108 | 127 |
| Ireland | 97 | 126 |
| Italy | 97 | 98 |
| Cyprus | 92 | 86 |
| Spain | 91 | 95 |
| Malta | 83 | 87 |
| Greece | 82 | 75 |
| Lithuania | 78 | 74 |
| Slovenia | 77 | 83 |
| Portugal | 76 | 75 |
| Poland | 74 | 68 |
| Slovakia | 73 | 76 |
| Czech Republic | 72 | 80 |
| Latvia | 67 | 67 |
| Estonia | 63 | 72 |
| Hungary | 63 | 67 |
| Croatia | 61 | 61 |
| Romania | 54 | 54 |
| Bulgaria | 49 | 47 |
| Norway | 139 | 191 |
| Switzerland | 130 | 158 |
| Iceland | 113 | 116 |
| Turkey | 60 | 55 |
| Montenegro | 52 | 42 |
| Serbia | 43 | 36 |
| former Yugoslav Rep. of Macedonia | 41 | 35 |
| Bosnia and Herzegovina | 38 | 29 |
| Albania | 36 | 30 |
1. Actual Individual Consumption consists of goods and services actually consumed by individuals, irrespective of whether these goods and services are purchased and paid for by households, by government, or by non-profit organisations. In international volume comparisons of consumption, AIC is often seen as the preferable measure, since it is not influenced by the fact that the organisation of certain important services consumed by households, like health and education services, differs a lot across countries. This indicator is listed among the recommendations of the Stiglitz-Sen-Fitoussi report.
- The figures are based on GDP and population data for 2013, extracted on 1 June 2014, and the most recent PPPs available. Revised estimates will be published in December 2014.
- The Purchasing Power Standard (PPS) is an artificial currency unit that eliminates price level differences between countries. Thus one PPS buys the same volume of goods and services in all countries. This unit allows meaningful volume comparisons of economic indicators across countries. Aggregates expressed in PPS are derived by dividing aggregates in current prices and national currency by the respective Purchasing Power Parity (PPP). The level of uncertainty associated with the basic price and national accounts data, and the methods used for compiling PPPs imply that differences between countries that have indices within a close range should not be over-interpreted.
For further information, see the Statistics Explained article on the Eurostat website.
- The high GDP per capita in Luxembourg is partly due to the country's large share of cross-border workers in total employment. While contributing to GDP, these workers are not taken into consideration as part of the resident population which is used to calculate GDP per capita.
- The eurozone consists of Belgium, Germany, Estonia, Ireland, Greece, Spain, France, Italy, Cyprus, Latvia, Luxembourg, Malta, the Netherlands, Austria, Portugal, Slovenia, Slovakia and Finland.
Share this article:
EU Reporter publishes articles from a variety of outside sources which express a wide range of viewpoints. The positions taken in these articles are not necessarily those of EU Reporter. Please see EU Reporter’s full Terms and Conditions of publication for more information EU Reporter embraces artificial intelligence as a tool to enhance journalistic quality, efficiency, and accessibility, while maintaining strict human editorial oversight, ethical standards, and transparency in all AI-assisted content. Please see EU Reporter’s full A.I. Policy for more information.


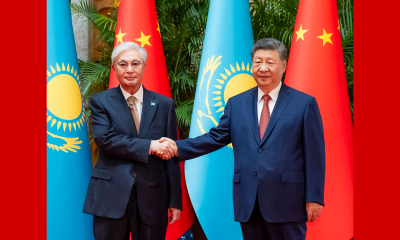
Kazakhstan seeks regional AI leadership as economic partnership with China enters new phase

Setting a new benchmark in premium travel

Survey on an EU Blueprint for intellectual property licensing and spinoff creation

Rule of law report strengthens EU democracy and fundamental rights

Burnham as PM? 'Wait and see'

Statement by the Ministry of Foreign Affairs of the Republic of Kazakhstan

Kazakhstan and Belgium: Building a Partnership for the Future

Kazakhstan: Central Election Committee reviews the results of the nomination of candidates for the deputies of Kurultai

Commission sends Statements of Objections to several companies and trade associations in suspected construction chemicals cartel

Commission endorses Latvia’s €617 million Social Climate Plan to support vulnerable households and transport users in the clean transition

Commission fines AliExpress €550 million for breaching the Digital Services Act

Astana Hub unveils infrastructure to support AI innovation in health care

The security environment of the South Caucasus amid changing geopolitical realities

Why the US is losing its legitimacy as a global superpower and the trust of the comity of nations

Commission launches EU-Ukraine Drone Alliance to boost drone and counter-drone technology

EU and Portugal team up to keep brightest tech talents at home

Kazakhstan reforms under scrutiny at Brussels Press Club round table

Japan should face up to history and contribute more to regional peace

Ambassador calls for 'speeding up' of co-operation between EU and Kazakhstan

Timur Turlov at Smart Moves Summit 2025: How chess can transform global education

Shevtsova’s case: Out-of-court sanctions dismantling trust in Ukrainian cause
The future of European transport

Trump Vs Trueman

US 'no longer' an 'unconditional ally' for Europe - MEP
-
 China5 days ago
Kazakhstan seeks regional AI leadership as economic partnership with China enters new phase
-
 Aviation/airlines3 days ago
Setting a new benchmark in premium travel
-
 Intellectual Property Rights3 days ago
Survey on an EU Blueprint for intellectual property licensing and spinoff creation
-
 EU law3 days ago
Rule of law report strengthens EU democracy and fundamental rights